Edition 6: The Fixed Ops Decade
What the data actually shows
Start with the correction, because it matters. The instinct to call this market "stabilizing" is wrong, and the data proves it.
2022 to 2024 was calm. Tight ranges. Predictable swings. Then Q1 2026 happened. Shopper interest and Days to Turn both spiked to their highest points in six years, higher than anything during the 2020-2022 chip-shortage chaos. That's not equilibrium. That's the single most volatile stretch since the pandemic, landing in the most recent data we have.
Here's the part that actually matters: shoppers showed up. Sold percentage didn't follow. People were in the market, pricing vehicles, running numbers, and walking away. That gap between interest and action is the real story on this data. Not supply. Not demand. The distance between the two.
Wholesale tells a quieter version of the same story. It hasn't collapsed, Manheim's index sits flat year-over-year, wholesale supply up about two and a half days from last August. Call it steady. Not thriving. Dealers are still buying. They're just not chasing.
Six forces building the wall
Interest rates. The Fed has held at 3.50%-3.75% since December 2025, and held again on July 29, a 9-3 vote, with three regional presidents actually pushing for a hike, not a cut. Core inflation is still running above target. The labor market just posted a negative payroll month. The Fed is caught between two signals pointing in opposite directions, and every month that goes unresolved is another month of expensive financing sitting on top of every deal.
Insurance. Full-coverage premiums are climbing again in over 30 states after insurers spent 2025 competing prices down. Connecticut alone is looking at roughly 15% by year-end. Stack an $850 payment against a $350 insurance bill, add fuel, maintenance, registration, ownership cost clears $1,300 to $1,500 a month before anyone's touched a repair bill. Customers aren't saying they can't afford the car. They're saying they can't afford owning it.
The aging fleet. Average vehicle age just hit 12.8 years, a record, still climbing. People aren't trading. They're extending.
Tariffs. Steel, aluminum, copper, a blanket import duty, new vehicle prices are up an average $1,315 in Q1 2026 alone versus a year earlier, and the average transaction price just broke $51,974, a new all-time high. Domestic destination fees are up 25%, now running $713 higher than fees on imported vehicles. The tariffs built to protect domestic production are, in the short run, making everything more expensive regardless of where it's built.
Credit. Subprime auto delinquency opened 2026 at 6.8% on 60-day past-due, worse than the Great Recession, a 32-year high. Prime paper is fine. Capital One's disciplined book is actually improving. This isn't one auto market anymore. It's two, moving in opposite directions, and most dealers are still running one playbook across both.
Geopolitics. The mechanism worth watching isn't gas prices at the pump, it's inputs. Iranian strikes on Qatari LNG infrastructure pushed helium prices up roughly 40%, and helium is a real input to semiconductor fabrication. Add already-strained aluminum supply from unrelated production disruptions, and you've got a second cost-push layer building underneath the tariffs, quietly, before anyone's watching for it.

The shift
Every one of those six forces points the same direction. This market didn't move from a supply problem to a demand problem. It moved from a supply problem to an affordability problem. That's the sentence that should be driving every merchandising, financing, and staffing decision made this year, not inventory levels, not lead volume. Affordability.
Why the gap exists: the Theory of Thirds
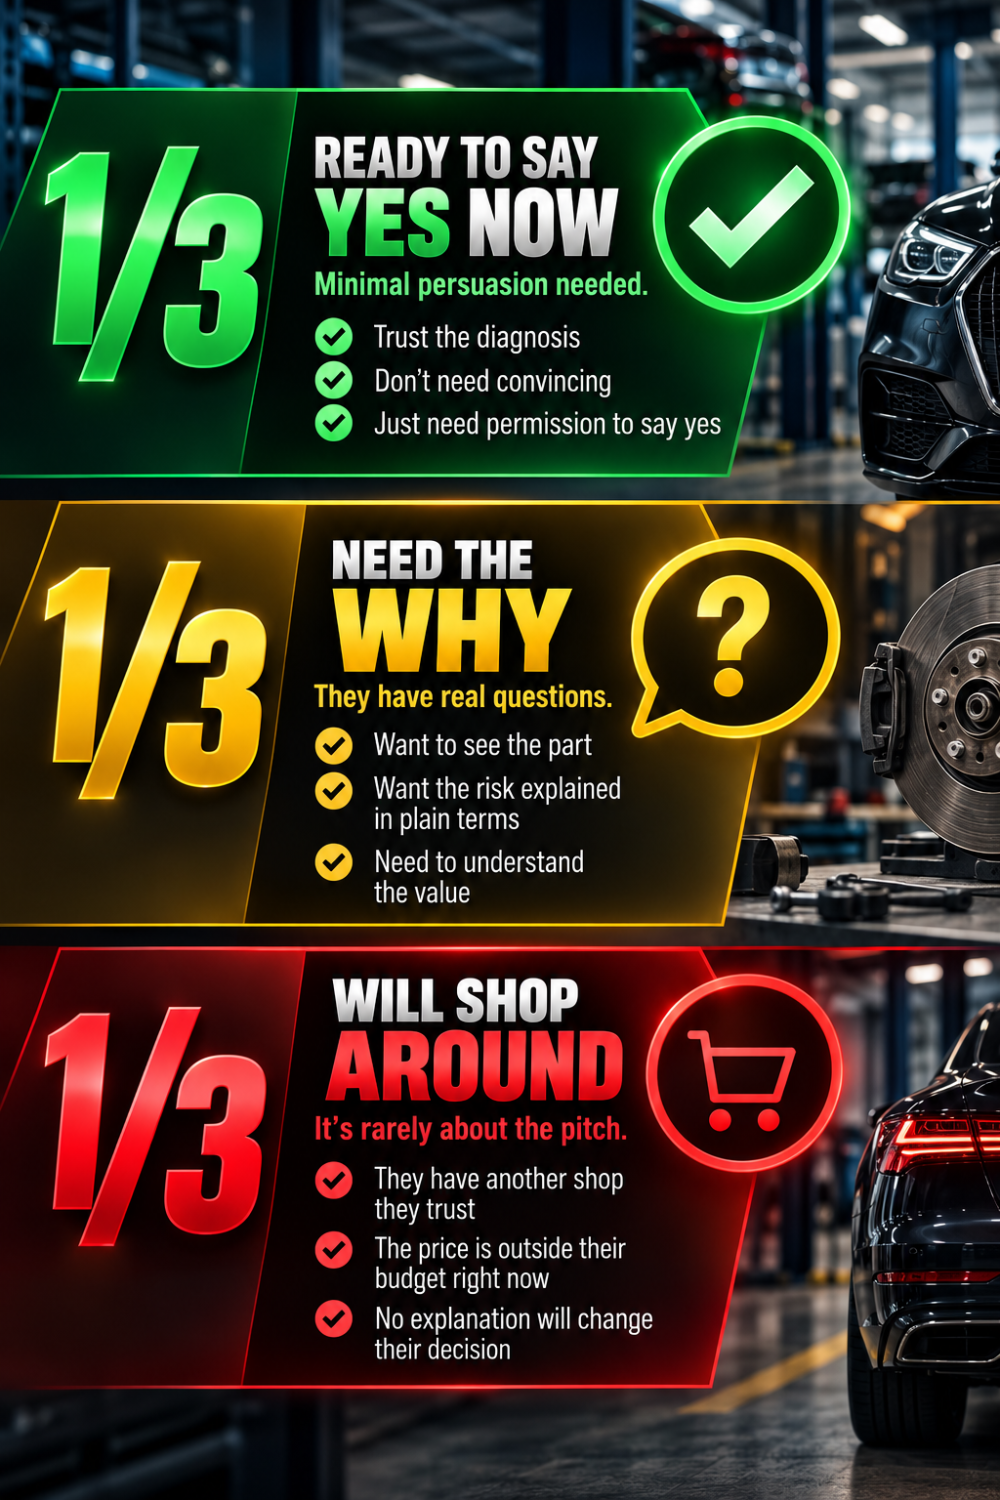
There's a framework I use to read every conversion problem in this business, and it explains the shopper-interest chart better than any macro headline does. Split any group of active shoppers into three. The top third is ready now, motivated, qualified, just needs the right presentation. The bottom third isn't buying regardless of what you do, tire-kickers, early-stage researchers, six-plus months out. The middle third is where deals actually get won or lost, and it's also the third that affordability pressure hits hardest.
That middle third used to convert on a normal follow-up cadence, a call at Day 3-5, a check-in at Day 14, a close attempt at Day 30-45, because the math worked well enough that hesitation was about preference, not payment. It isn't preference anymore. The behavioral tells have changed: more return visits to the same listing without a call, more "let me talk to my spouse" that used to close in a week and now stretches a month, more shoppers who've already run their own payment calculator before they ever talk to you. That's not disengagement. That's the middle third doing math you can't see, and losing the argument with themselves in real time because the numbers are worse than they were eighteen months ago.
This is exactly the group the shopper-index spike represents. They're not the top third, those still convert, which is why sold percentage never fully collapsed. They're not the bottom third either, bottom-third shoppers don't spike a six-year-high interest index. It's the middle third, in volume, running the math over and over and coming up short. Which means the fix isn't more traffic. It's a follow-up and financing process built for a middle third that needs help clearing an affordability bar, not just one more reason to want the vehicle.
Why this decade belongs to Fixed Ops
Put the pieces next to each other. Vehicles are staying on the road longer than ever. New vehicle ownership costs are pricing out a growing share of buyers. Subprime credit is under real stress, which means the customers who need a repair the most are the ones least able to finance a replacement. Technician labor is tightening as experienced techs retire and the pipeline behind them thins. And the industry's own answer to that labor gap, AI-driven scheduling, diagnostics, and productivity tooling, is a force multiplier for the department that already runs on data, not a replacement for it.
Cars last longer. Repairs get more complex. Labor rates rise. Parts revenue grows. Service contracts hold value when new-vehicle affordability doesn't. Recurring service revenue is more predictable than a sales department chasing a shopper who window-shops for six weeks and never signs.
Call it what it is: the Fixed Ops Decade. Not because sales stops mattering. Because for the first time in a long time, the math favors the department built around retention over the one built around acquisition.
Measure the connection, not just the departments
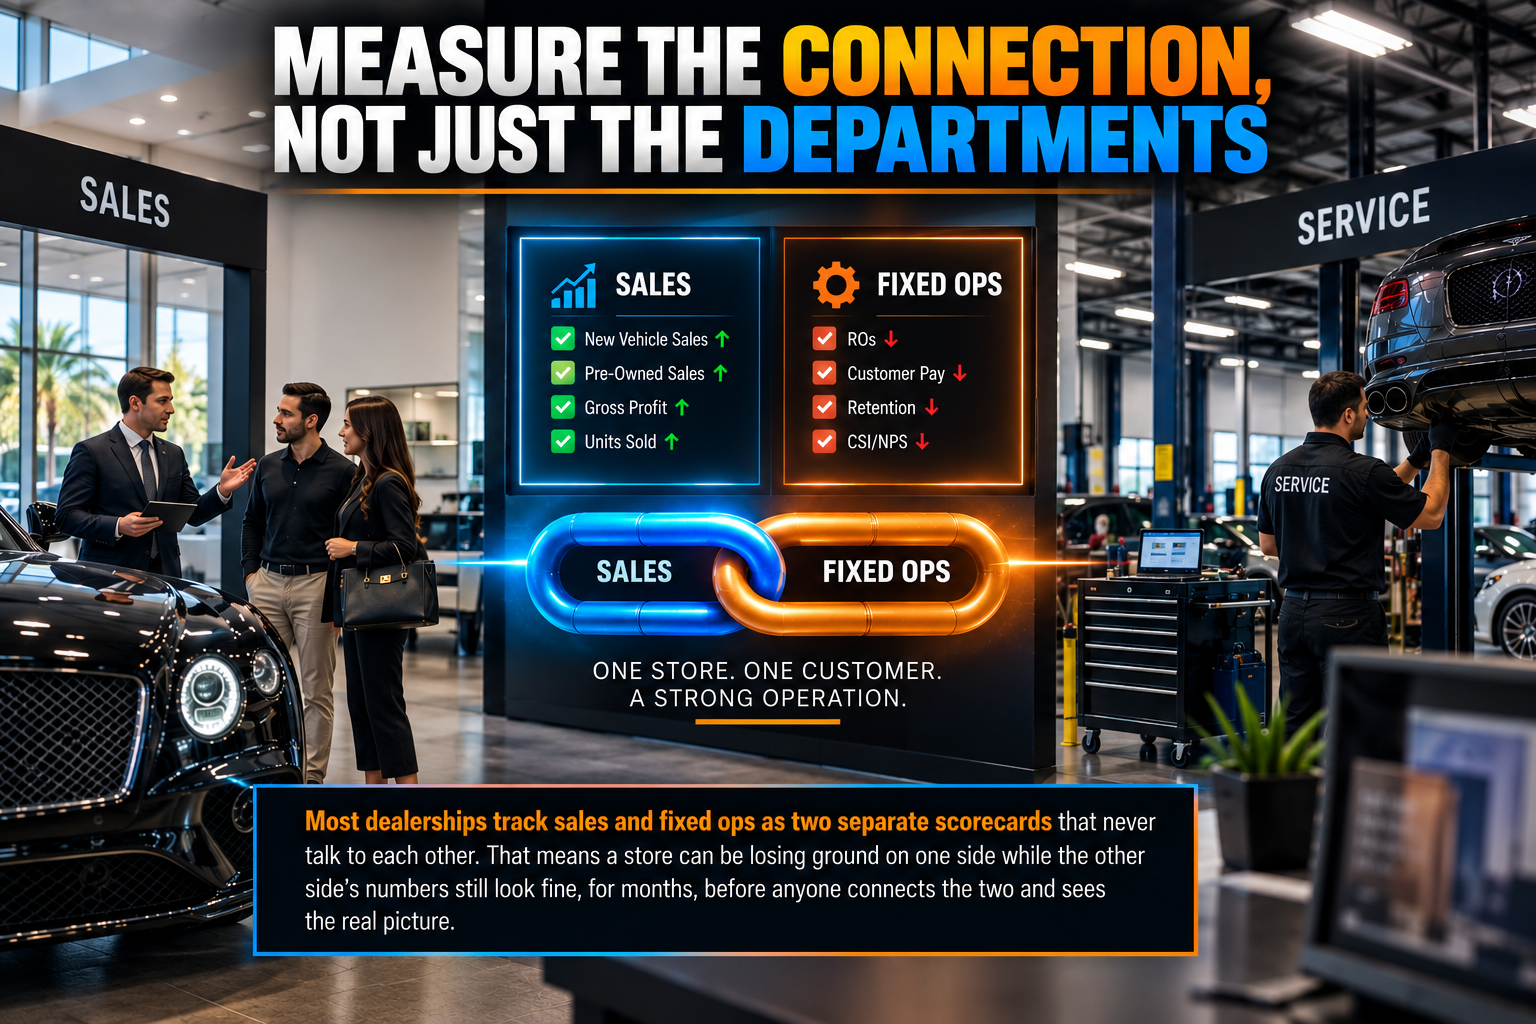
Most dealerships track sales and fixed ops as two separate scorecards that never talk to each other. That means a store can be losing ground on one side while the other side's numbers still look fine, for months, before anyone connects the two and sees the real picture.
That's the case for something like the Store Connectivity Index, a single number blending Fixed Absorption Rate with Service Retention Rate, so fixed ops health and sales health sit on the same page instead of drifting apart while each hits its own target in isolation. Absorption tells you whether fixed ops alone can carry the store's fixed costs. Retention tells you whether you're actually capturing the ownership lifecycle this whole article has been about, or just riding a temporary bump in walk-in traffic. A store can protect one of those numbers in isolation and still be losing ground everywhere else. A store that connects both grows volume and margin at the same time, because sales and service are being managed as one system instead of two departments that happen to share a building.
If you're a GM or a Fixed Ops Director and you don't know your store's number on something like this, that's the first gap to close, not because it's a vanity metric, but because it's the earliest place this thesis will show up on your own P&L, months before it shows up anywhere else.
The playbook
If I were running fixed ops through this stretch, here's where the effort goes, and two of these carry extra weight from frameworks I already run every day.
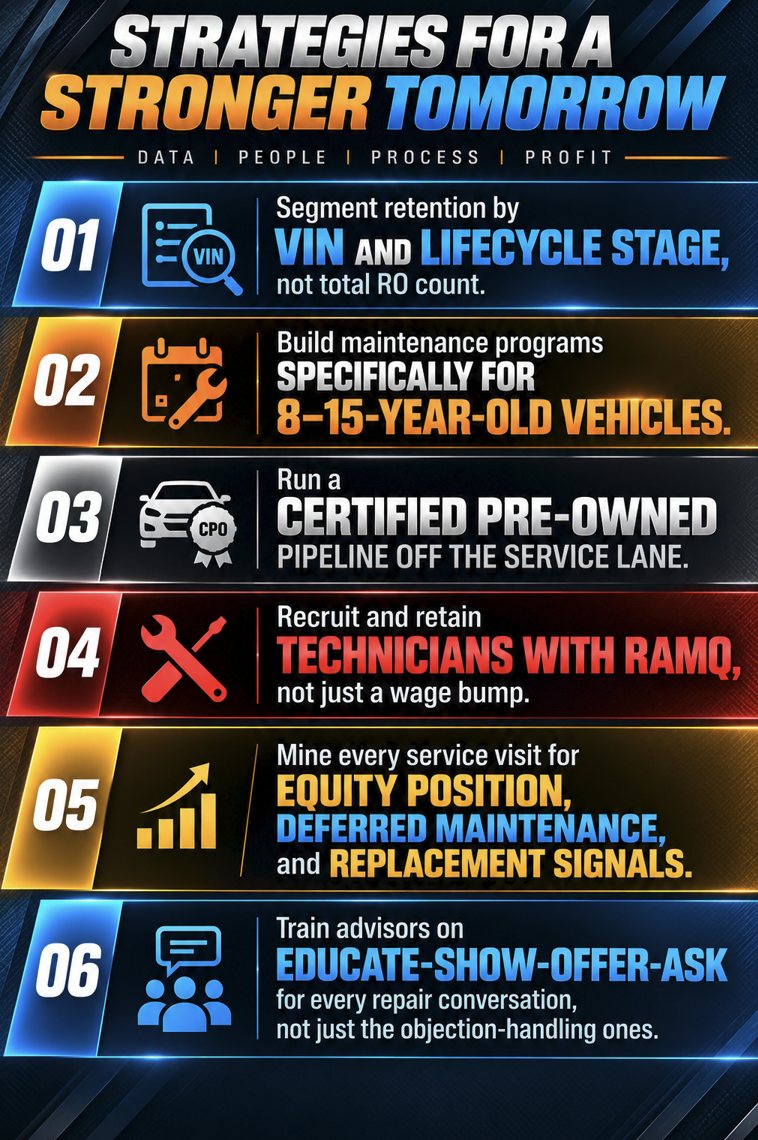
Segment retention by VIN and lifecycle stage, not total RO count. A dealership doesn't have one customer base. It has cohorts at different points in an ownership curve, protect the newer owners who are still easy to keep, work to convert the mid-cycle owners deciding whether your shop is worth the drive, and build a real recapture motion for lapsed customers instead of writing them off. Total RO count hides which of those three groups is actually moving.
Build maintenance programs specifically for 8-15-year-old vehicles. That's where the demand actually is now, and it's underserved by programs built around newer, warrantied units.
Run a certified pre-owned pipeline off the service lane. The customer already trusts your shop. That trust is inventory you haven't been collecting.
Recruit and retain technicians with RAMQ, not just a wage bump. Pay matters, but Recognition, Advancement, Money, and Quality of Life is the fuller retention equation, and most stores only pull the Money lever. A tech who sees an advancement path, gets recognized for the work instead of just clocked for the hours, and has a schedule that respects their life outside the shop stays through a labor market this tight for reasons a competitor's counteroffer can't touch. The stores that only compete on wage are competing on the one lever everyone else can match by Friday.
Mine every service visit for equity position, deferred maintenance, and replacement signals. That data already lives in your CRM. Most stores never look at it.
Train advisors on Educate-Show-Offer-Ask for every repair conversation, not just the objection-handling ones. Educate on what the vehicle actually needs and why. Show it, on the lift, on video, in the multi-point inspection, not just on a printout. Offer the range of ways to handle it: pay now, finance it, phase the work across two visits, tie it to a maintenance plan. Ask for the decision directly instead of letting the customer leave to "think about it," which is exactly where affordability anxiety turns a yes into a no. The affordability conversation that's killing sales deals doesn't have to kill service tickets; it just needs the same structure you'd use on any other objection.
The winners
Average stores will keep chasing units and wondering why days-to-turn keeps swinging under them. Elite stores will stop treating fixed ops as the department that keeps the lights on between sales pushes, and start treating it as the growth engine it already is on paper.
The next five years won't belong to the dealerships that sell the most cars. They'll belong to the ones that know their customers best, who retain longer, capture more of the maintenance lifecycle, and use service data to generate the next sale instead of waiting for a shopper to walk back in.
To the advisors reading this: this is where your ceiling just went up. To the GMs and DPs evaluating who runs fixed ops for you next: this is the case for why that hire matters more than it used to. See you on the next one.
-Steve
Sources for the "Six forces" data as of the date of this article:
IntInterest rates — Federal Reserve, FOMC policy decision, July 29, 2026
Insurance — Insurify 2026 Car Insurance Report; ConsumerAffairs, "Car insurance costs are rising again in 2026"
Average vehicle age — S&P Global Mobility, "U.S. Vehicle Age Rises Again to 12.8 Years"
Tariffs / transaction prices — Motor1, "Average New Car Prices Just Hit a Record High"; DealershipGuy, "New-vehicle prices surge from impact of tariffs"
Subprime credit delinquency — The Motley Fool, "Subprime Auto Loans Just Hit Their Worst Delinquency Rate in 32 Years" (July 2026)
Geopolitics / input costs've got a second cost-push layer building underneath the tariffs, quietly, before anyone's watching for it.