Edition 9: What Units in Operation Actually Tells You About Your Service Drive
Most fixed ops departments can recite their retention percentage without looking it up. Far fewer could tell you, within a thousand vehicles, how many units of their brand actually exist in their market right now. That gap matters more than it sounds like, because a retention number measured against the wrong population is a number that's confidently wrong.
Retention isn't really one number. It's at least three, and most departments only ever look at one of them.
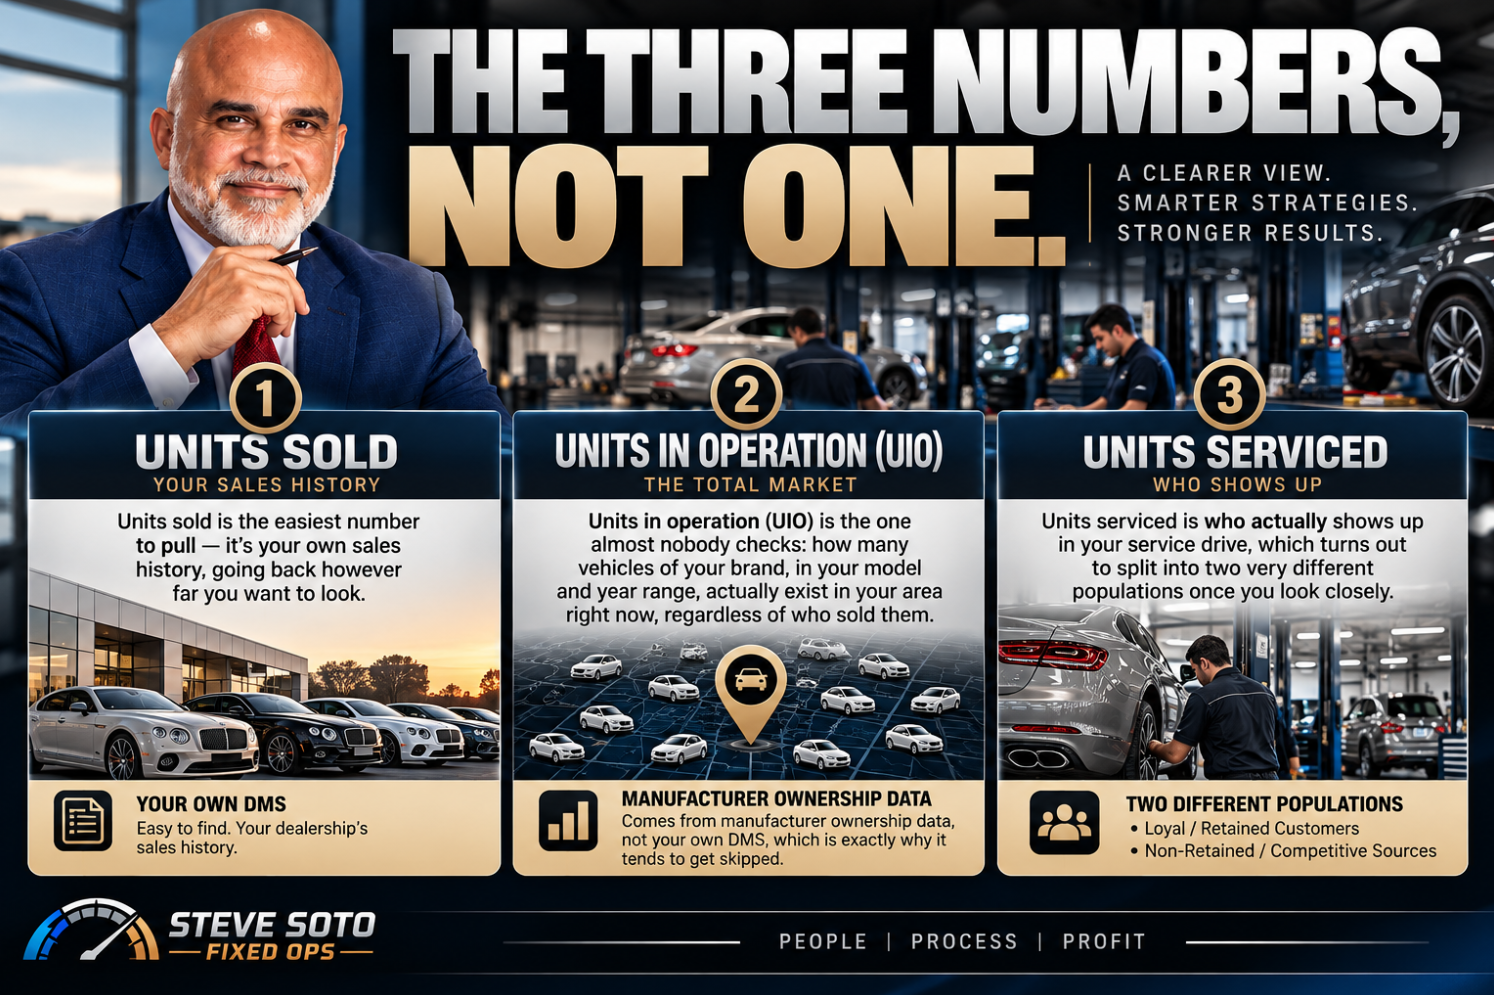
Three Numbers, Not One
Units sold is the easiest number to pull — it's your own sales history, going back however far you want to look.
Units in operation (UIO) is the one almost nobody checks: how many vehicles of your brand, in your model and year range, actually exist in your area right now, regardless of who sold them. This comes from manufacturer ownership data, not your own DMS, which is exactly why it tends to get skipped, it requires pulling a report that lives outside the systems a department checks daily.
Units serviced is who actually shows up in your service drive, which turns out to split into two very different populations once you look closely.
Loyalty vs. Conquest, Two Different Kinds of Retention
Of the units you service, some are vehicles you sold that came back. That's loyalty retention, and it's the number most departments already track.
The other population is vehicles you didn't sell, bought elsewhere, that are now in your service drive anyway. That's conquest, and it tells you something loyalty retention can't: whether your service department can win and hold customers independent of what your sales department did. A store with strong conquest numbers isn't just retaining what sales handed it, it's actively taking market share in the service bay on its own.
Here's an illustrative version of how the math works, using clean round numbers rather than any real store's figures:
Say a store's sales history shows 300 units sold in its market over a multi-year window. The manufacturer's ownership data shows 150 vehicles in that same model range currently registered in the area, a mix of units that store sold and units sold by other dealers. Of those 150, the store services 110 of the ones it actually sold, a 73% loyalty retention rate. It also services 100 conquest units it never sold at all. Total units serviced: 210. Measured against the local population of 150, that's 140% penetration, more units serviced than theoretically exist locally from that store's own sales history, which only makes sense once conquest is counted as its own category rather than folded into "retention" as if it were the same thing.
That number is worth sitting with. A department that only ever reports loyalty retention is telling half the story, and often underselling itself, because the conquest half is proof the service experience itself is competitive, not just a byproduct of the sales department's volume.
It also changes the conversation with a sales team that assumes fixed ops exists downstream of them. A service department with a meaningful conquest number isn't dependent on sales handing it customers, it's generating its own, from guests who bought the brand somewhere else and chose this service drive on its own merits. That's a different kind of leverage in a leadership conversation than "our retention is good," because it isolates what the service side is actually contributing on its own.

The Gap Is Where the Opportunity Lives
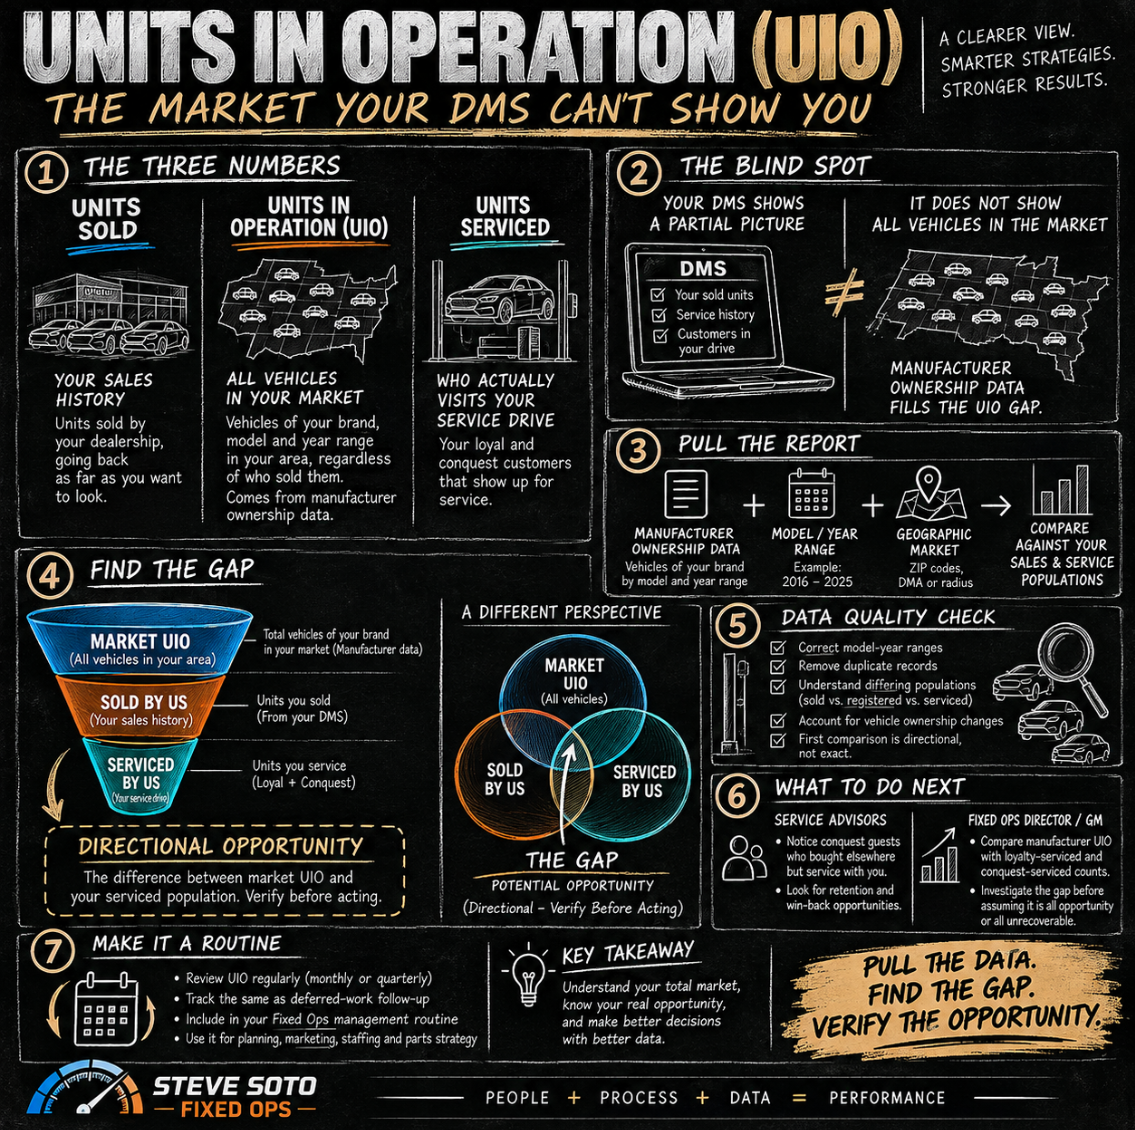
Run the subtraction the other direction and a different number shows up: 150 local units in operation, minus 110 loyalty-serviced, leaves a 40-unit gap, vehicles the store sold, or vehicles that theoretically exist in its sold population, that aren't showing up in its own service drive.
That gap isn't automatically lost business. It breaks down into a handful of honest explanations:
Customers the store genuinely never sold to, despite appearing in the sold-population estimate
Customers servicing somewhere else entirely
Vehicles sold locally that later left the market
Vehicles not yet due for their next service
Ownership changes the data hasn't caught up to
Straightforward mismatches between two different data populations
Most of that gap is explainable and not recoverable. But not all of it. If even a modest share of that 40-unit gap turns out to be genuinely local customers quietly servicing elsewhere, that's a specific, countable number of real recovery opportunities, not a vague sense that "we should be doing better," but an actual figure you can multiply against your own average invoice value to see what it's worth chasing.
Why Most Departments Never Run This
The reason this analysis is rare isn't that it's complicated. It's that the UIO half of it doesn't live anywhere a department checks by habit. Your DMS will tell you everything about the customers already in your service drive. It won't tell you how many vehicles exist in your market that aren't.
That's the same shape of problem as a CRM full of declined work nobody's calling back, or a parts shelf going obsolete nobody's reviewing, the information exists, it's just sitting in a place that isn't part of anyone's normal routine. A UIO comparison isn't a new skill to learn. It's a report that has to get pulled and set next to numbers you already have, on a cadence, the same way everything else worth tracking in this department gets tracked.
It's also worth being honest about the data's limits before leaning on it too hard. Ownership data and your own sales history rarely define their populations identically, model-year ranges get drawn differently, duplicate records happen, and a vehicle that changed hands can show up in neither population cleanly or in both. None of that means the exercise isn't worth doing. It means the 40-unit gap in the example above is a starting point for a conversation, not a number precise enough to act on without a second look. Treat the first pass as directional, close enough to tell you whether it's worth digging further, not close enough to present as exact.

What To Actually Do with It
If you're an advisor, the next time a guest tells you where they bought their vehicle, that's not small talk, a guest who bought elsewhere and chose your service drive anyway is a conquest win worth noticing, and worth treating like the vote of confidence it actually is.
If you're a fixed ops director or GM, pull your manufacturer's ownership data for your market and model range, then set it next to your own loyalty-serviced and conquest-serviced numbers. Find your own gap. Don't assume it's all unrecoverable before you've looked, and don't assume it's all opportunity either. Somewhere between those two assumptions is a real number, and it's worth knowing which one you're actually sitting on.
See you on the next one.
-Steve