KPI Command Center
Edition 1: KPI Command Center
Aug 9
Welcome to the first edition of Steve Soto Fixed Ops. Where high-performing Fixed Operations leaders sharpen their strategy.
This newsletter is dedicated to helping dealership leaders build more profitable, guest-focused, and operationally excellent service departments.
If you're reading this, you've subscribed to get systems, not slogans, the actual frameworks I use to run a fixed ops department, delivered straight to you instead of hoping the algorithm shows it to you. Every edition here is going to be more complete than what fits in a feed post: the full picture, not the highlight.
Each edition delivers practical insights on leadership, customer retention, financial performance, operational efficiency, team development, and the systems that drive long-term success. Drawing from real-world experience in luxury automotive retail, I share proven strategies, measurable KPIs, and actionable frameworks that help Fixed Operations teams improve performance while creating exceptional guest experiences.
Two audiences are going to get real value from this newsletter, and I'd rather say that directly than hope you read between the lines. If you're an advisor, a service manager, or a fixed ops director, this is built to make you sharper at the job, and you'll find practical ideas you can put to work immediately.
If you're an up-and-coming GSM ready to take on the General Managers seat, a new GM, a dealer principal, or you're building out a leadership bench, this is where you'll see exactly how I think, exactly how I diagnose a department, and exactly how I lead a team through change.
The right place to start is the framework everything else is built on. So, edition one is the whole thing, pillar by pillar.
Why Most Dashboards Fail
Most service departments track outcomes instead of levers. Gross profit is an outcome. Hours per RO is a lever. CSI is an outcome. First-time-fix rate is a lever.
If you only watch outcomes, you find out you had a bad month after it already happened. If you watch the levers, you can catch a problem mid-week, sometimes mid-day, while there's still time to fix it before it shows up on next month's financial statement.
I built my KPI system around four pillars: Market Penetration & Retention, Financial Performance, Operational Efficiency, and Customer Experience. About 15 numbers total, spread across those four. Every elite department I've seen tracks all of them at meaningful frequency, not just the five everyone defaults to because that's what the DMS shows on the home screen.
Pillar 1: Market Penetration & Retention
Retention by vehicle age segment. I track this across three bands, segments, (segment 1) 0-4 years, (segment 2) 5-7 years, and (segment 3) 8+ years, with a different target and a different retention strategy for each. A 2-year-old car owner is protecting a warranty and building loyalty toward their next purchase. A 12-year-old car owner is deciding, repair by repair, whether this car is worth keeping alive, and whether your store is the one they trust to make that call honestly. Treat both the same way and you'll quietly lose both, for completely different reasons. Think about this for a moment, don't just read it.
Knowing your market share by segmented vehicles is a piece no one really talks about. What is your capture rate for each one?
Service retention on units the store itself sold. This is the metric that connects fixed ops back to the sales side of the business. A weak number here usually isn't a service problem to solve alone, it's a signal about how well the sales delivery process set the customer up to come back in the first place.
How many times are you going to one of your sales managers and asking for the list of the new vehicles you sold last year this month? How many are you reaching out too? How many have already come back for their first service? Again stop for a moment and think about that AND we are just only talking segmented one vehicles. We are not even cracking into the rest of the bands of potential opportunities yet with vehicle segments two and three. Treat both the same way and you'll quietly lose both, for completely different reasons.
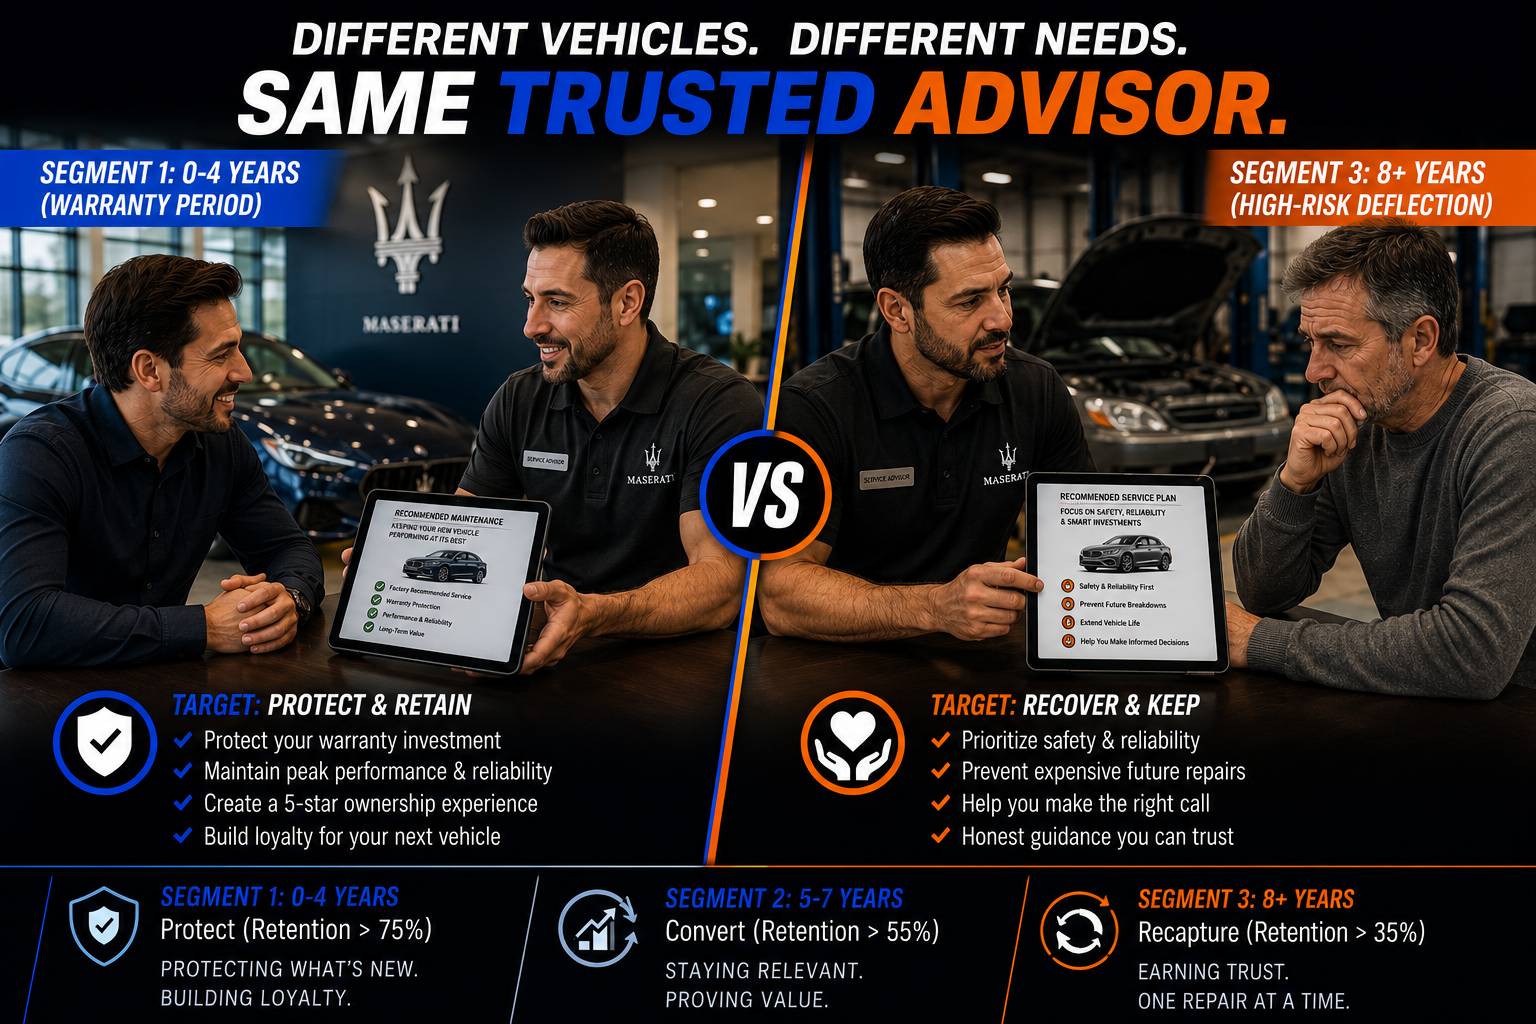
Treat both the same way and you'll quietly lose both, for completely different reasons.
Pillar 2: Financial Performance
Fixed Absorption Rate. The cleanest number in the entire framework, what percentage of the store's fixed expenses does fixed ops alone cover. This turns "slow sales month" from a vague worry into simple math: this is how much runway fixed ops is buying the store right now.
Are you keeping score here? Do you know this number?
Expense percentage. I hold this below 65% as a standing discipline. Cost control and revenue growth get treated as competing priorities in a lot of departments, they aren't, once the right systems are in place underneath both.
There is a metric to each expense. For example, how to figure out a healthy pay plan for your advisor team, technician team, etc. that keeps you inline when it comes to your net to gross. How much of the pie goes where?
I'm going to go deeper on this one, because I had a hard lesson here and why 65%? Let me explain.
Expense percentage is the ratio of total department expenses to total gross profit the department generates:
Expense % = Total Fixed Ops Expenses ÷ Total Fixed Ops Gross Profit
So if your service and parts departments produce $100 in gross profit, and it costs $65 in expenses to produce that $100, you're sitting at 65%. The remaining 35 cents on every dollar of gross is what actually flows to net profit for the department.
What counts as "expense" in that number
This isn't just one line item, it's everything that eats into gross before it becomes profit:
Advisor and technician pay plans (including flat-rate hours paid, not just hours sold)
BDC salaries and any commission structure
Shop supplies, tools, uniforms
Warranty and policy adjustment costs (comebacks factor in here, this is one reason FRFT and expense percentage are connected, not separate numbers)
Semi-fixed allocations, the department's share of rent, utilities, insurance
Advertising and marketing spend attributed to fixed ops
Why below 65% specifically
It's a widely used benchmark in our industry, departments running efficiently tend to land somewhere in the 65-70% range, and 65% or below is generally considered strong performance rather than just adequate. It's not an arbitrary round number so much as a line that separates "profitable and disciplined" from "profitable but bloated."
Why it's a lever, not just a scoreboard number
The reason it belongs in the Command Center rather than just showing up on a monthly financial statement is that it's controllable in real time, through decisions like:
Not over-hiring ahead of actual RO volume (most brands - Topic for another day)
Keeping comebacks down (this is where FRFT directly protects this number, every redo job is expense with no matching gross)
Managing pay plan structure so it scales with productivity instead of growing faster than gross
Watching semi-fixed costs instead of treating them as untouchable overhead
The reason it sits next to Fixed Absorption Rate under Financial Performance is that the two work as a pair: Fixed Absorption tells you how much of the store's overhead fixed ops is covering. Expense percentage tells you how efficiently fixed ops is generating the gross that makes that coverage possible in the first place. I had to LEARN some hard lessons, especially with financial performance. I am sharing them if you read between the lines.
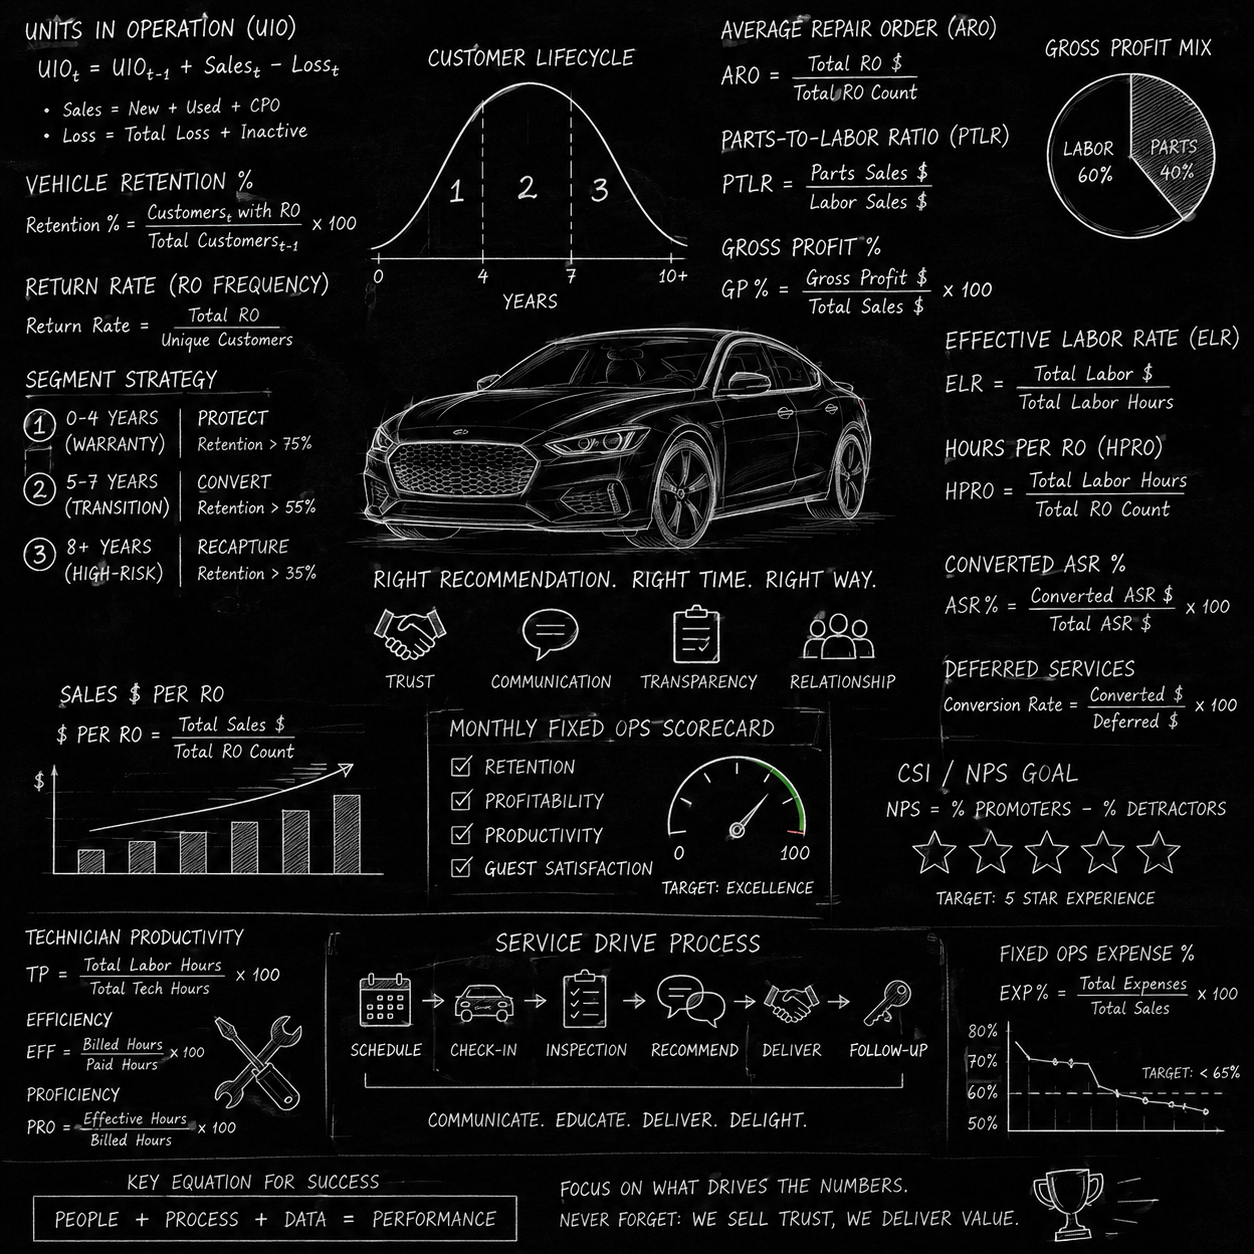
I had to LEARN some hard lessons, especially with financial performance. I am sharing them if you read between the lines.
Effective Labor Rate and Hours per RO, read together, never separately. A rising ELR with falling hours per RO isn't progress, it's a shrinking department with a better sticker price.
In this line I am making a subtle but important diagnostic point about how a department can look healthy on paper while actually declining.
The two metrics:
Effective Labor Rate (ELR), the average amount you're actually collecting per labor hour billed. It's revenue per hour of work sold.
Hours per RO, the average number of labor hours sold on each repair order. It's volume of work per ticket.
Why they have to be read together:
Each one alone tells an incomplete story. ELR going up looks like a win, you're charging more, presumably capturing more value per hour. But ELR can rise for two very different reasons:
You're doing a better job selling the value of the work, upselling correctly, and your team's skill level supports a higher rate. That's real growth.
You're simply raising the rate on a shrinking pool of work, fewer repair orders, fewer hours sold per car, fewer jobs walking in the door, and the higher rate is covering for the lost volume.
Pillar 3: Operational Efficiency
First-Time-Fix Rate, 95% or higher. If I could only track one number in the entire framework, it would be this one. FRFT isn't an outcome, it's the cause of almost every outcome that follows. A customer who comes back twice for the same problem doesn't just cost you redo labor. They stop trusting the next recommendation, and that follows them into every future visit. We will deep dive this in another article or newsletter edition. A customer who comes back twice for the same problem doesn't just cost you redo labor.
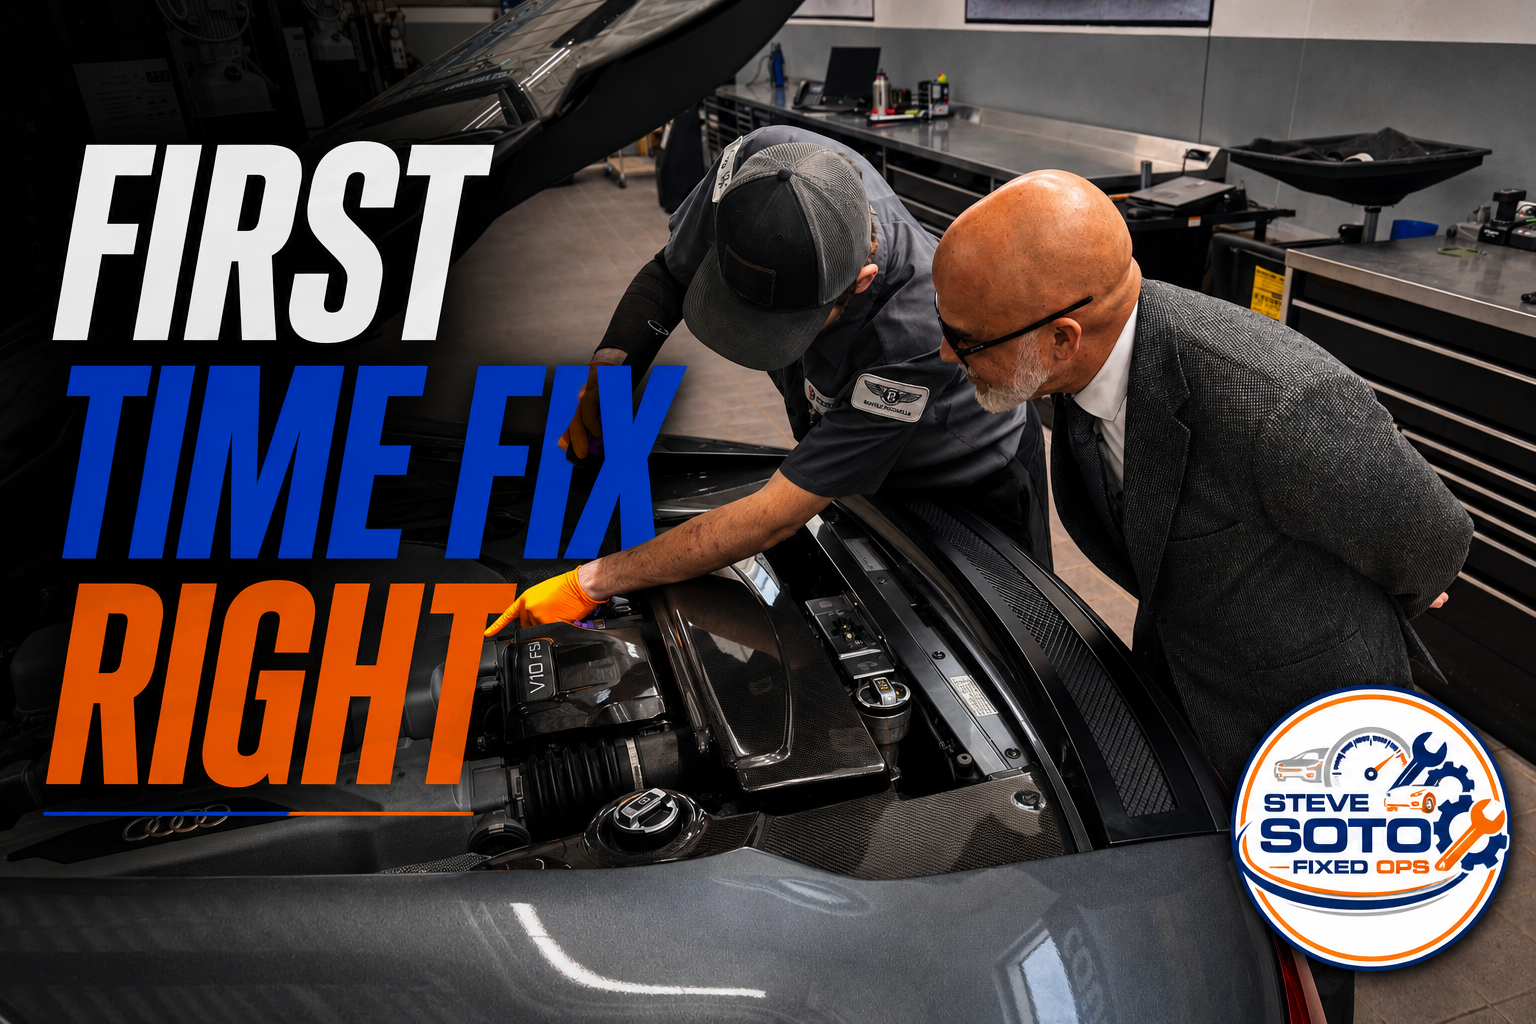
A customer who comes back twice for the same problem doesn't just cost you redo labor.
MPI completion, 100%. Every car, every time. This is the floor, not the goal, completion alone doesn't move the needle on its own; it's the input the next pillar builds on. No exceptions here. No excuses.
CP hours per RO, trended against trailing sales volume. A lagging indicator, but a real one, today's units are tomorrow's service business.
This is one I will deep dive now, because it is a different failure mode mistaking a market problem for an execution problem.
The metric:
CP hours per RO, Customer Pay hours per Repair Order. "Customer pay" means the customer is paying out of pocket, as opposed to warranty work (manufacturer-paid) or internal work (dealership-paid, like reconditioning). CP is the highest-margin, most controllable part of the service business, so it's the number everyone watches most closely.
What "trended against trailing sales volume" means:
Instead of just watching CP hours per RO rise or fall in isolation, you plot it against new/used vehicle sales volume from previous periods, not this month's sales, but sales from a year or two (or more) back. You're asking: does the current service business line up with how many cars were actually sold into this market in the past? We actually talked about this in Pillar 1, "Service retention on units the store itself sold."
Why "lagging" but still "real":
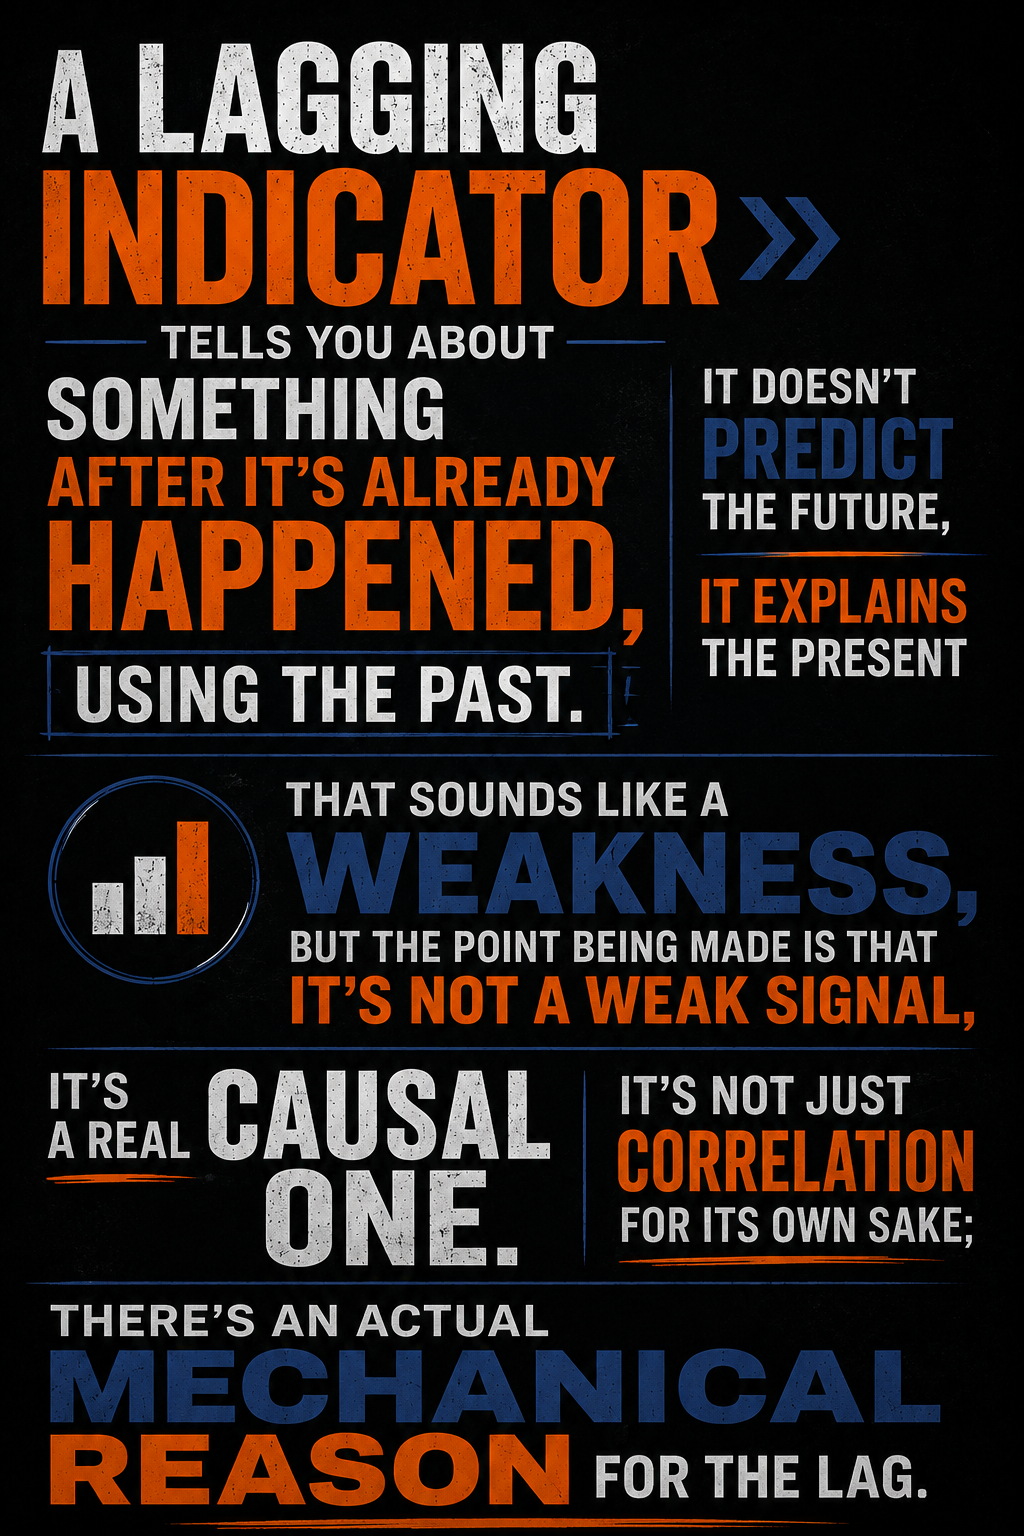
A lagging indicator tells you about something after it's already happened, it doesn't predict the future, it explains the present using the past. That sounds like a weakness, but the point being made is that it's not a weak signal, it's a real causal one. It's not just correlation for its own sake; there's an actual mechanical reason for the lag.
Read it again!
"Today's units are tomorrow's service business":
This is the causal chain: a car sold today doesn't usually need much service today (segment 1 vehicles). It comes back for service in meaningful volume 1, 2, 3+ years down the road, oil changes, tires, brakes, and eventually the bigger repairs as it ages past warranty (segment 2 vehicles). So the CP service volume you're doing right now isn't really a reflection of this year's sales, it's a reflection of sales from several years back, working their way through the ownership cycle.
Why this matters diagnostically:
If CP hours per RO or overall CP volume is soft, the first instinct is often to blame the service team, poor upselling, weak advisor performance, declining trust. But if you trend it against trailing sales, you might find the real answer is upstream: the store simply sold fewer units 2-3 years ago, so there are fewer cars in the "service-heavy" part of their lifecycle right now. That's not a service execution problem, it's a sales-volume-from-the-past problem, and no amount of retraining advisors fixes it.
I can firmly confirm this and I bring it up in detail because of my experience the last three years running a fixed operations campus for Bentley and Maserati. I have first-hand experience on establishing year over year gains in a brand-new market and the work and systems that I needed to put in to be successful, hence the reason I am sharing this channel out here for us all.
Still, it's all the same underlying discipline as the ELR/Hours per RO point: don't judge a number by itself, judge it against the thing that actually explains it, in this case, time-shifted sales data instead of this month's sales data.
Pillar 4: Customer Experience
MPI view rate, 85% or higher. Completion and viewing are two entirely different metrics. Completion means an inspection happened somewhere behind the scenes. View rate means the customer actually saw the photos and video, the proof, not just a checked box.
The Multi-Point Inspection is more than a checklist, it's a reflection of your commitment to your technicians, your guests, and your dealership's culture.
Every completed MPI represents a technician's expertise, time, and attention to detail. That's real work. The question is whether your dealership treats it that way.
Here's where most stores get it wrong: they train hard on completion and stop there. But an MPI that never reaches the guest didn't accomplish anything, it just happened somewhere behind the scenes. That's the gap between a shop running 100% completion and one actually hitting an 85% view rate. The difference isn't the technician's effort. It's what happens to that effort after the inspection is done.
Every Additional Service Recommendation an MPI generates should reach the guest. Full stop. Service Advisors own that handoff, confirming the guest received it by text or email, walking through the findings, answering questions, documenting the outcome. Skip any part of that, and the technician did the work for nothing.
Technicians notice when their inspections get presented right, and when they don't. When the work is communicated consistently and professionally, they see it land, and that respect shows up everywhere: higher engagement, more accepted recommendations, stronger guest trust, a team pulling in the same direction. Especially the technicians that have not bought into the video MPI.
This is where elite dealerships separate from average ones. They don't just require technicians to complete MPIs. They build the system that guarantees every inspection gets valued, every recommendation gets communicated, and every guest gets the full benefit of what the technician already found.
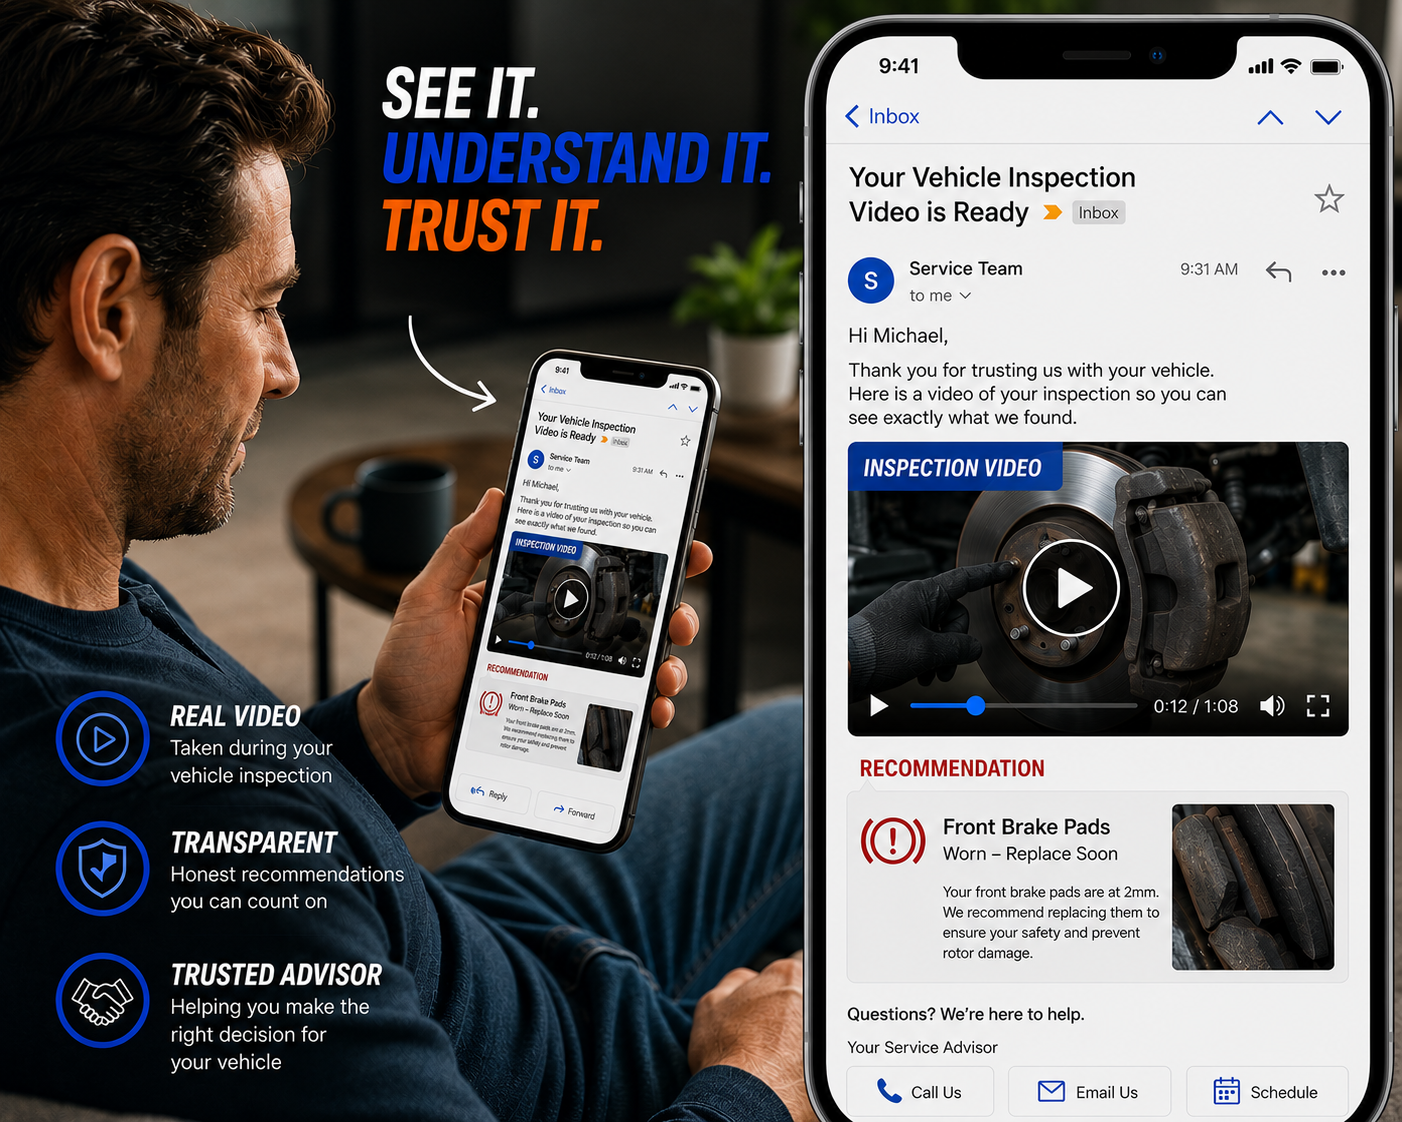
View rate means the customer actually saw the photos and video, the proof, not just a checked box.
BDC show rate, 70% or higher. The BDC gets treated as a phone-answering function in a lot of stores. It's a revenue function and show rate is the fastest read on whether that revenue is being created or quietly leaking out before the customer ever reaches the drive.
CSI, tracked here deliberately as a downstream outcome rather than a standalone target, chasing CSI directly, without the levers underneath it, is how departments end up managing the score instead of the experience that produces it.
View rate means the customer actually saw the photos and video, the proof, not just a checked box.
Why the Four Pillars Work Together
None of these numbers mean much read alone. A department can have a great Fixed Absorption Rate and a quietly collapsing retention number underneath it. The pillars are built to be read against each other, on the same dashboard, not as four separate reports reviewed by four different people once a month.
That's the actual function of a Command Center: not more data, but the right data, organized so a leader can see the whole department at once and know exactly where to look before a problem becomes a number on next month's financial statement.
I broke some of these down further than other, and as I share more, I will deep dive the rest.
Lead with purpose. Operate with discipline. Deliver an experience guests remember.
That's the foundation. Every future edition builds on one piece of this — objection handling, retention psychology, turnaround playbooks, team leadership. If you found this useful, the best thing you can do is share it with someone building or leading a department of their own.
I will be sharing random post here on my profile feed, as well as several separate articles that you will mirror the newsletters, but go deeper into the systems I share.
Let's connect and see you in the next one.
-Steve
Proverbs 27:23